New Activity
Play Quiz
1. 
You are asked to review a drawing for hole note errors. Which of the following drawings contains no errors?
A.
B.
C.
D.
2. 
Which of the following is most likely the method used to model this part in a 3D solid modeling software package?
A.
B.
C.
D.
3. 
Would additive or subtractive modeling procedures be the best practice to use to create the object above in 3D modeling software?
A.
additive procedures
B.
subtractive procedures
C.
both additive and subtractive procedures
4. 
Which set of sectional views is in the same order as the drawings shown below?
A.
B.
C.
D.
5. 
What is the volume of the part shown in the multiview drawing below?
A.
3.054 inches cubes
B.
3.000 inches cubed
C.
3.196 inches cubes
D.
3.108 inches cubes
6. 
Which distribution shape describes the data set?
A.
bimodal
B.
symmetrical
C.
positively skewed
D.
negatively skewed
7. 
What is the range in feet from all trials and launch points? Round your answer to the nearest tenth. Enter the answer.
8. 
The students create a graph comparing different ranges in distance outcomes to the frequencies at which those distances occur within the outcomes. Which types of graphs should the students create to compare the data? Select all that apply.
A.
line graph
B.
histogram
C.
scatter plot
D.
frequency table
9. 
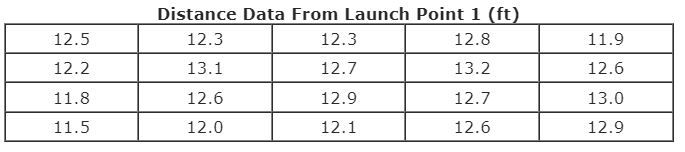
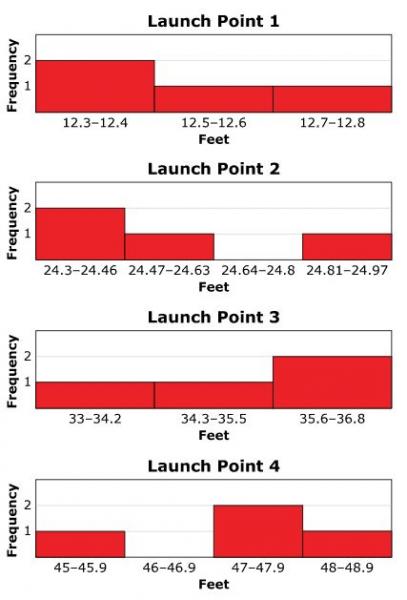
The students need more data. They launch 16 more times from each launch point (a total of 20 trial launches from each point). All distance data in feet from launch point 1 are shown. What is the mean distance in feet for all trails launched from point 1? Round your answer to the nearest tenth. Enter the answer.
10. 
The standard deviation of all trials launched from point 1 is 0.46 ft. Select the words to complete the sentence describing what this standard deviation means about the data.
A.
far from, mean, high
B.
close to, mean, low
C.
far from, range, high
D.
close to, range, frequency