How many students went to a pool at least ten times last summer?
4.
[]
How many students went to the pool less than ten times last summer?
5.
[]
If the given table was turned into a bar graph, Which category would represent the mode of the data?
6.
Which graph would best represent the data in the table?
A.
B.
C.
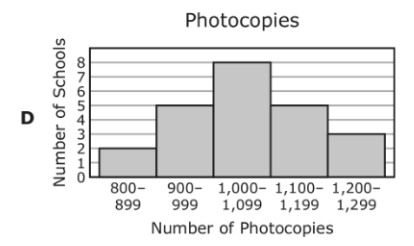
D.
7.
[]
If the given table was turned into a bar graph, Which category would represent the mode of the data?
A.
B.
C.
D.
8.
[]
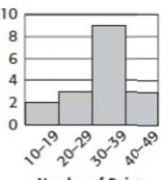
The number of points scored in each basketball game were recorded: 28, 16, 38, 44, 21, 38, 35, 48, 33, 29, 37, 39, 18, 38, 42, 37, 32 Which graph would represent this data the besst?
A.
B.
C.
D.
9.
[]
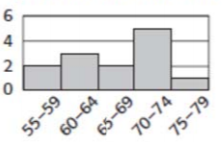
The speeds(mph) of various roller coasters in a theme park were logged for daily records: 62, 64, 72, 75, 71, 68, 55, 58, 68, 72, 70, 60, 72 Which graph would best represent the given data?
A.
B.
C.
D.
10.
[]
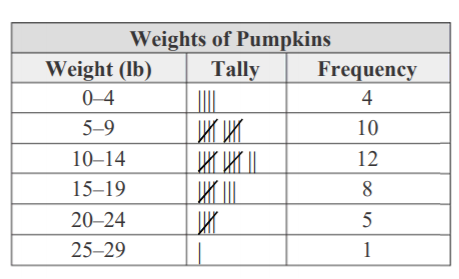
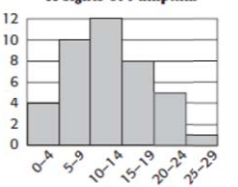
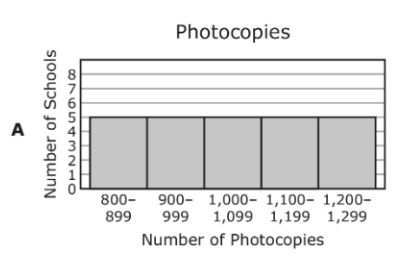
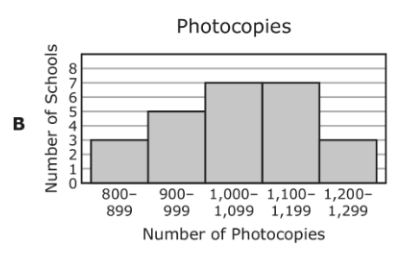
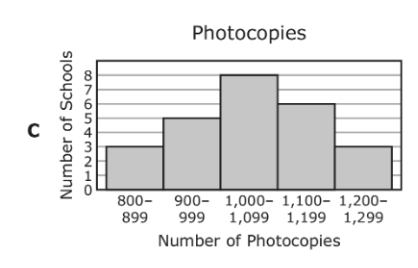
The table shows the numer of photocopies made during one day at each of the 25 schools in the district. Which histogram dispays all of the data in the table correctly?